Third Level Assessment– Aquatic and Riparian Habitat
Rapid Geomorphic Assessments
Rapid Geomorphic Assessments
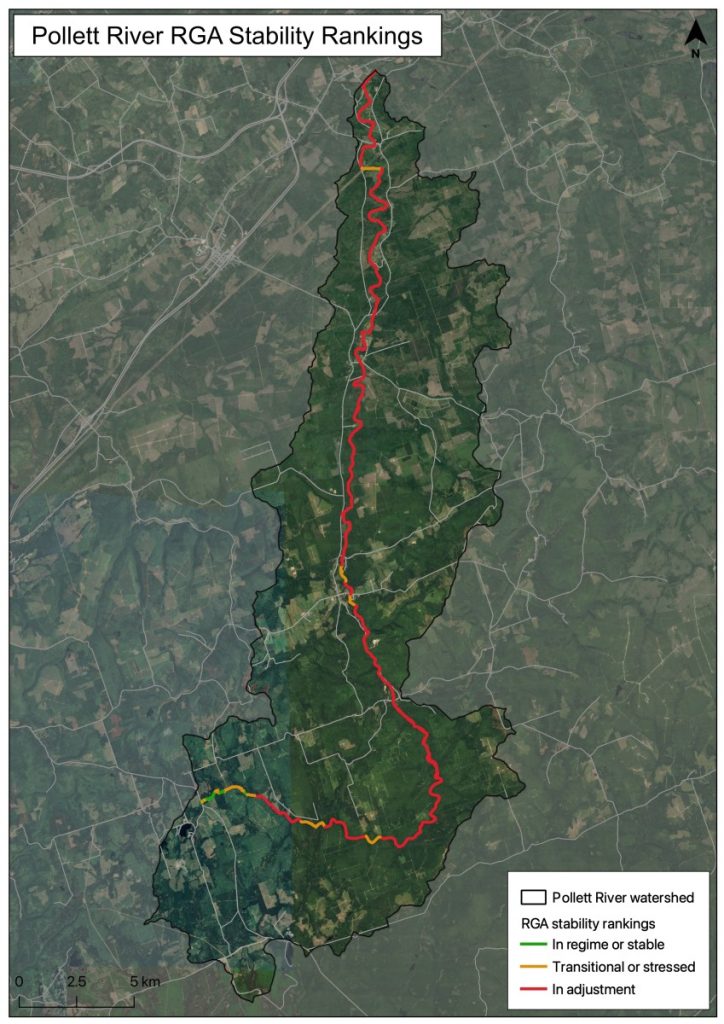
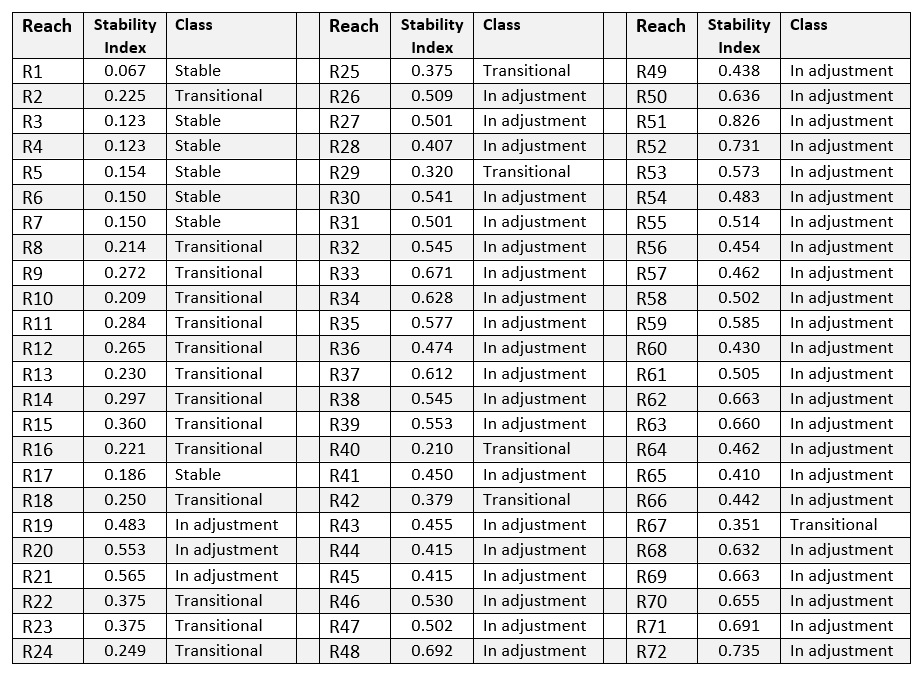
Data collected during Rapid Geomorphic Assessments (RGAs) on the Pollett in 2021 allowed evaluation of the geomorphic condition and stability of the assessed reaches of the Pollett River. To interpret the geomorphic data, Figure 9 was highlighted according to reach stability
Rapid Geomorphic Assessments are used to quantify channel stability based on the presence and (or) absence of key indicators of channel adjustment with respect to four categories: 1) Aggradation, 2) Degradation, 3) Channel Widening, and 4) Planimetric Form Adjustment. Each indicator is described in detail below.
Aggradation
Channel aggradation may occur when the sediment load to a river increases (due to natural processes or human activities) and it lacks the capacity to carry it. Piles of sediment in the river can re-direct flows against the banks, leading to erosion and channel widening.
Typical indicators used to identify aggradation include:
- Shallow pool depths.
- Abundant sediment deposition on point bars.
- Extensive sediment deposition around obstructions, channel constrictions, at upstream ends of tight meander bends, and in the overbank zone.
- Most of the channel bed is exposed during typical low flow periods.
- High frequency of debris jams.
- Coarse gravels, cobbles, and boulders may be embedded with sand/silt and fine gravel.
- Soft, unconsolidated bed.
- Mid-channel and lateral bars.
Degradation
Degradation occurs as the river cuts deeper into the land and decreases its gradient. This can occur from a rapid removal of streambed material due to an increase in discharge, water velocity, or a decrease in sediment supply. Bed lowering can move in both an upstream (as a headcut or nick point) and/or downstream direction. Indicators of degradation include:
- Elevated tree roots.
- Bank height increases as you move downstream.
- Absence of depositional features such as bars.
- Head cutting of the channel bed.
- Cut face on bar forms.
- Channel worn into undisturbed overburden/bedrock.
Widening
Widening typically follows or occurs in conjunction with aggradation or degradation. With aggradation, banks collapse when flows are forced on the outside, and the river starts to widen. Wide, shallow watercourses have a lower capacity to transport sediment and flows continue to concentrate towards the banks. Widening can be seen with degradation, as it occurs with an increase in flows or decrease in sediment supply. Widening occurs because the stream bottom materials become more resistant to erosion (harder to move) by flowing waters than the stream banks. Indicators of widening include:
- Active undermining of bank vegetation on both sides of the channel, and many unstable bank overhangs that have little vegetation holding soils together.
- Erosion on both right and left banks in riffle sections.
- Recently exposed tree roots.
- Fracture lines at the top of banks that appear as cracks parallel to the river, which is evidence of landslides and mass failures.
- Deposition on mid-channel bars and shoals.
- Urbanization and storm water outfalls leading to higher rate and duration of runoff and channel enlargement typically in small watersheds with >10% impervious surface.
Planform Adjustment
These are the changes that can be seen from the air when looking down at the river. The river’s pattern has changed. This can happen because of channel management activities (such as straightening the bends of the river with heavy equipment). Planform changes also occur during floods. When there is no streambank vegetation with roots to hold soil in place, rivers cut new channels in the weak part of the bank during high water. Planform adjustments typically are responses to aggradation, degradation, or widening geomorphic phases. Indicators include:
- Flood chutes, which are longitudinal depressions where the stream has straightened and cut a more direct route usually across the inside of a meander bend.
- Channel avulsions, where the stream has suddenly abandoned a previous channel.
- Change or loss in bed form, sometimes resulting in a mix of plane bed and pool-riffle forms.
- Island formation and/or multiple channels.
- Additional large deposition and scour features in the channel length typically occupied by a single riffle/pool sequence (may result from the lateral extension of meanders).
- Thalweg not lined up with planform. In meandering streams, the thalweg typically travels from the outside of a meander bend to the outside of the next meander bend.
- During planform adjustments, the thalweg may not line up with this pattern.
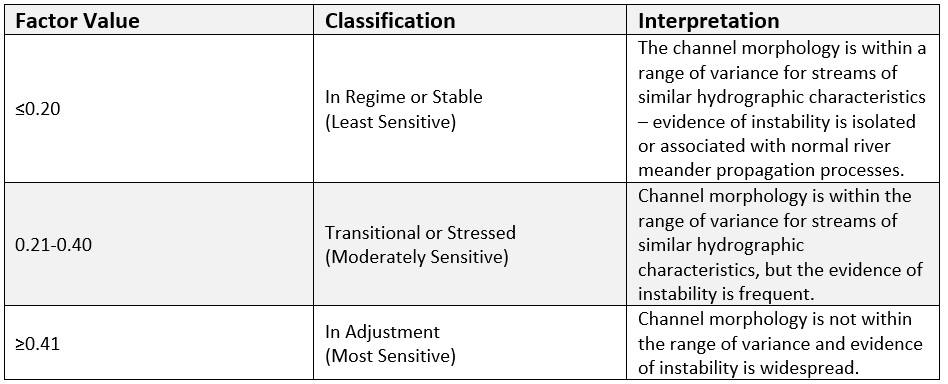
Upon completion of the field inspection, indicators are tallied for each category to produce an overall reach stability index. The index classified the channel in one of three stability classes (Table 4):
Table 4: RGA reach stability index classification
The RGA stability index results for the Pollett River found that approximately 64% of the reaches are in adjustment – as per Table 5, the most sensitive state. Only 10% of the reaches assessed were found to be stable (in regime). The remaining 26% was transitional between these two states. Figure 9 shows that while conditions start out fairly good at reach 1 at Highway 114, as the channel stability is lost, and the river falls into “In adjustment” it remains that way for most of its length.
Table 5: Pollett River Stability Index Scores from RGA Surveys
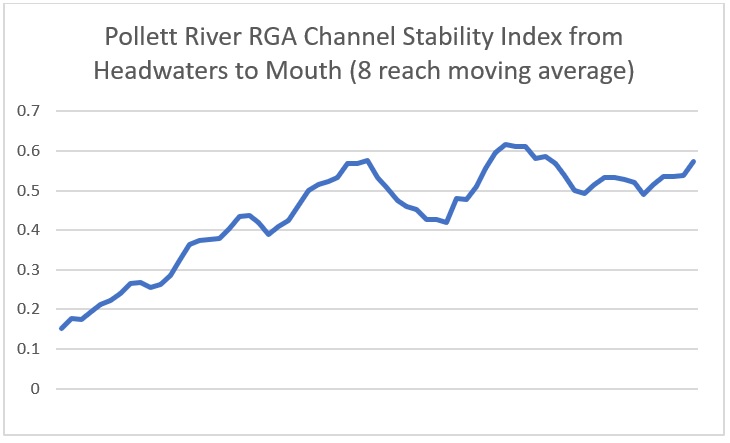
Limitations of the ranking regime are reflected in the loss of some of the variability within the stability index down the length of the Pollett in Figure 10 – due to the wide range between ranks. Initially the average Stability Index starts out “stable” (low <0.2), but the values rapidly increase into the “transitional” range (0.21 to 0.40), and then the average remains “in adjustment” (≥0.41) for the remainder of the river’s length (with the occasional individual reach dipping back into “transitional”). That could be misconstrued to mean that conditions in the thinly populated headwaters are better than further downstream. It does not. If conditions in the headwaters were better, then they would not show the steepest rise (i.e., sharpest and most consistent decline in stability). Problems in the river move one direction- downstream. By the time one reaches the lower portions of the Pollett instability is common- but variable and has plateaued somewhat. The average in Figure 10 first peaks at reach 39 just above the gorge. Below Elgin it falls (becomes more stable). It starts to rise again at reach 48 a short distance above Beaman’s Hole, and then reaches its ultimate peak below the Parkindale Bridge. From that point onwards stability improves somewhat as one moves further downstream, but not to such an extent that it shifts from “In adjustment” to “transitional” and remains there.
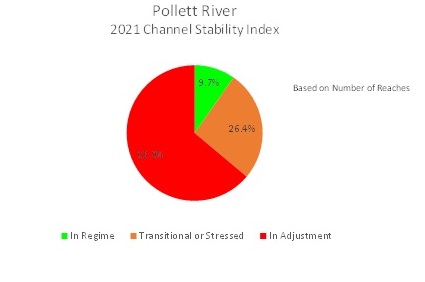
Variation in length of reaches is also a factor. According to Figure 11, calculated based on the number of reaches in the Pollett, 63.9 % of the reaches are stressed, 26.4% of the reaches are going through a state of transition and only 9.7% of the reaches assessed are in a state of regime (stable).
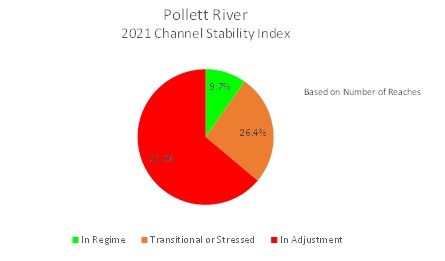
However, in Figure 12, comparing reach length to overall assessed channel length, the amount of assessed channel that is in a state of adjustment increases to approximately 86%. The actual amount of channel length that is relatively stable drops down to just under 2%.