Third Level Assessment – Aquatic and Riparian Habitat Assessment
Geomorphic Assessments
Data collected from the Rapid Geomorphic Assessment (RGA) was used to evaluate the geomorphic condition and stability of the assessed reaches North River. In order to interpret the geomorphic data, the included maps of the watercourse are highlighted according to reach stability as well as the Primary Geomorphic Processes impacting each reach.
Rapid Geomorphic Assessments are used to quantify channel stability based on the presence and (or) absence of key indicators of channel adjustment with respect to four categories: 1) Aggradation, 2) Degradation, 3) Channel Widening, and 4) Planimetric Form Adjustment. Each indicator is described in detail below.
Aggradation
Channel aggradation may occur when the sediment load to a river increases (due to natural processes or human activities), and it lacks the capacity to carry it. Piles of sediment in the river can re-direct flows against the banks, leading to erosion and channel widening.
Typical indicators used to identify aggradation include:
- Shallow pool depths.
- Abundant sediment deposition on point bars.
- Extensive sediment deposition around obstructions, channel constrictions, at upstream ends of tight meander bends, and in the overbank zone.
- Most of the channel bed is exposed during typical low flow periods.
- High frequency of debris jams.
- Coarse gravels, cobbles, and boulders may be embedded with sand/silt and fine gravel.
- Soft, unconsolidated bed.
- Mid-channel and lateral bars.
Degradation
Degradation occurs as the river cuts deeper into the land and decreases its gradient. This can occur from a rapid removal of streambed material due to an increase in discharge, water velocity, or a decrease in sediment supply. Bed lowering can move in both an upstream (as a headcut or nick point) and/or downstream direction.
Indicators of degradation include:
- Elevated tree roots.
- Bank height increases as you move downstream.
- Absence of depositional features such as bars.
- Head cutting of the channel bed.
- Cut face on bar forms.
- Channel worn into undisturbed overburden/bedrock.
Widening
Widening typically follows or occurs in conjunction with aggradation or degradation. With aggradation, banks collapse when flows are forced on the outside, and the river starts to widen. Wide, shallow watercourses have a lower capacity to transport sediment and flows continue to concentrate towards the banks. Widening can be seen with degradation, as it occurs with an increase in flows or decrease in sediment supply. Widening occurs because the stream bottom materials become more resistant to erosion (harder to move) by flowing waters than the stream banks.
Indicators of widening include:
- Active undermining of bank vegetation on both sides of the channel, and many unstable bank overhangs that have little vegetation holding soils together.
- Erosion on both right and left banks in riffle sections.
- Recently exposed tree roots.
- Fracture lines at the top of banks that appear as cracks parallel to the river, which is evidence of landslides and mass failures.
- Deposition on mid-channel bars and shoals.
- Urbanization and storm water outfalls leading to higher rate and duration of runoff and channel enlargement typically in small watersheds with >10% impervious surface.
Planform Adjustment
These are the changes that can be seen from the air when looking down at the river. The river’s pattern has changed. This can happen because of channel management activities (such as straightening the bends of the river with heavy equipment). Planform changes also occur during floods. When there is no streambank vegetation with roots to hold soil in place, rivers cut new channels in the weak part of the bank during high water. Planform adjustments typically are responses to aggradation, degradation, or widening geomorphic phases.
Indicators of Planform Adjustment include:
- Flood chutes, which are longitudinal depressions where the stream has straightened and cut a more direct route usually across the inside of a meander bend.
- Channel avulsions, where the stream has suddenly abandoned a previous channel.
- Change or loss in bed form, sometimes resulting in a mix of plane bed and pool-riffle forms.
- Island formation and/or multiple channels.
- Additional large deposition and scour features in the channel length typically occupied by a single riffle/pool sequence (may result from the lateral extension of meanders).
- Thalweg not lined up with planform. In meandering streams, the thalweg typically travels from the outside of a meander bend to the outside of the next meander bend.
- During planform adjustments, the thalweg may not line up with this pattern.
Upon completion of the field inspection, indicators are tallied for each category to produce an overall reach stability index. The index classified the channel in one of three stability classes:
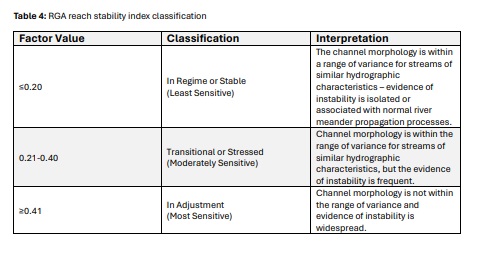
The RGA stability index results for the Anagance River are in Figure 9. Only the lowest 10 km of the river were assessed. This is the portion from the mouth of Hayward Brook to the confluence with the North River where the main stem of the Petitcodiac begins. The Anagance is a small river, and the channel upstream is too small for such assessment. Approximately 29% of the reaches are in adjustment – as per Table 4- the most sensitive state. Only 12% of the reaches assessed were found to be stable (in regime). The remaining 59% were transitional between these two states.


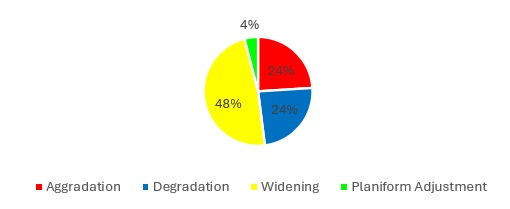
Widening was identified as the most common primary geomorphic process (48%), with Aggradation and Degradation tying for the second most common primary process (24% each) within the Anagance River watershed. Planform adjustment accounted for the remaining 4% (Figure 11 and Figure 12). An alternating pattern of aggradation and degradation emerged with these processes either presenting as the primary condition or secondary underlying channel widening.

Channel degradation was most commonly associated with widening, particularly in the most unstable reaches. Degradation may occur when there has been a significant increase in flow, a significant decrease in sediment supply, or a significant increase in slope due to channel straightening. In the middle reaches, degradation may be a result of increased flow provided by two incoming tributaries whose watersheds are heavily developed by roadways and cleared land. Land use conditions upstream of the assessed reaches (Figure 13) may also be contributing to the pattern of aggradation and degradation observed in the upper reaches.
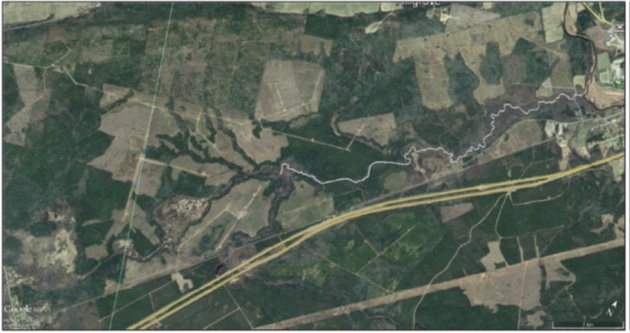
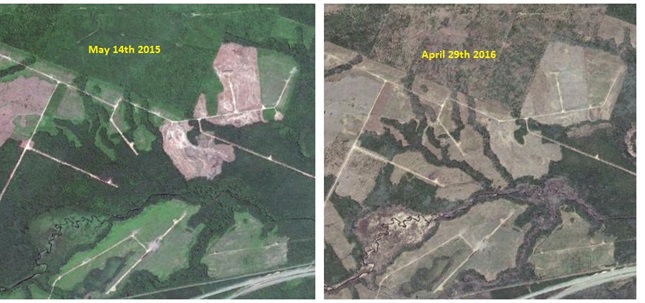
Altered land use in the form of paved roadways or land cleared of mature vegetation does not hold runoff as well as vegetated or forested land. This usually results in systems with high runoff, leading to higher peak flows and discharge over a relatively short period of time. These systems are referred to as flashy watercourses. Sediments may also be originating from these areas from improperly installed or maintained road crossings. This issue is further compounded due to the condition of the underlying soils which are characterized as highly to very highly susceptible to erosion in this area of the watershed (Wall et al 2002). Further investigation is required to pinpoint the source of sediments and cause of excessive degradation in the middle reaches. The land identified in Figure 13 appears to be part of J.D. Irving’s Industrial Freehold (Figure 4) and the clearings are clear cuts. Historical imagery confirms this (Figure 14). Most of that harvesting is quite recent – part of the May 2015 image appears to freshly harvested, with additional cutting by April 2016.